-1.png?height=40&name=Logo%20Eversports%20Horizontal%20(1)-1.png)
Table of contents
- 📊 Analytics: KPI's & Charts
Our studio's key numbers at a glance: bookings, revenue, and occupancy in real time. - 📁 Reports: all your exports in one place
Basic exports that you need, from bookings to product sales, ready to download.
- 💡 Getting the most out of Analytics & Reports
Common business questions studio owners ask and exactly where to find the answer.
-
🔍 Advanced Analytics: go further
Dig deeper into your data with custom formulas and cross-referenced reports.
1. 📊 Analytics
In the Analytics tab of your Manager, we want to help you better understand your business and identify important trends. You'll find key performance indicators (KPIs), charts, and , in the Reports tab next to it an overview of every report you can download and process further.
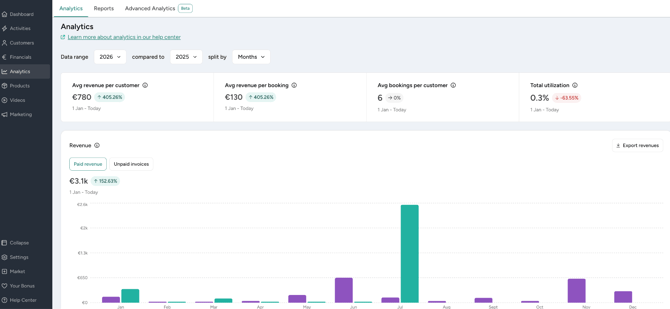
🔢 Key performance indicators (KPIs)
The Analytics page shows you four KPIs:
|
KPI |
What it tells you |
Why it's useful |
|
Average Revenue per Customer |
How much revenue you make on average per customer |
If you have a revenue target, you can work out how many more customers you need to reach it, useful for planning acquisition or retention efforts |
|
Average Revenue per Booking |
How much revenue you make on average per booking |
Helps you estimate how many additional bookings you need to hit a revenue goal , useful for planning your activity and product range |
|
Average Bookings per Customer |
How active your customers are, at a glance |
Tells you whether you should focus more on acquiring new customers or retaining existing ones |
|
Total Utilization |
How full your classes are in percentage |
The total utilization is calculated by dividing the total number of bookings with the total number of available spots. Only appointments with a maximum participant limit set and considered. |

📊 Charts
Below the KPIs, you'll find charts on revenue, bookings, customers, and memberships.
- Pick the year you want to analyze, and a comparison year.
- If the current year isn't over yet, totals are shown from the beginning of the year to today , and the comparison period adjusts automatically to match.
- If you manage multiple locations, you can view data for one, several, or all of them.
- Hover over a chart to see the exact numbers for a given month.
- Hover the ⓘ icon next to the chart to see exactly which value is being used.
1. Revenue
Compared to the previous year, and automatically calculated as either invoiced or paid revenue depending on whether you use income/expense accounting or double-entry bookkeeping. 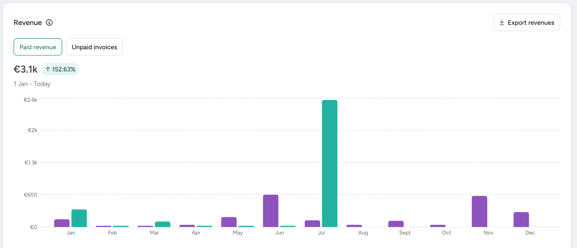
2. Bookings
Shows the number of: active bookings, all cancellations, late cancellations and on-time cancellations.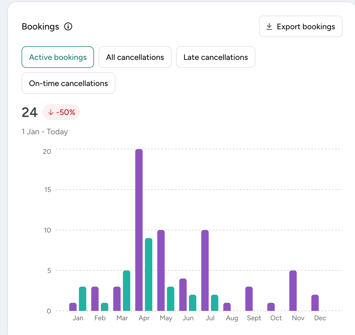
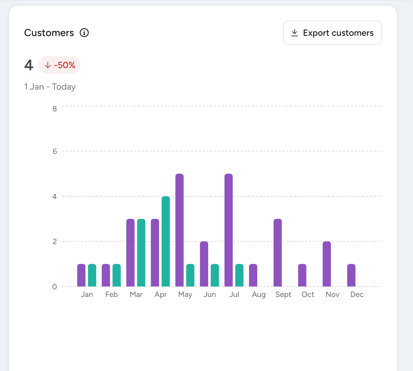
3. Customers
Counts customers with at least one non-cancelled booking in the period. A customer with bookings in both January and February will appear in both months.
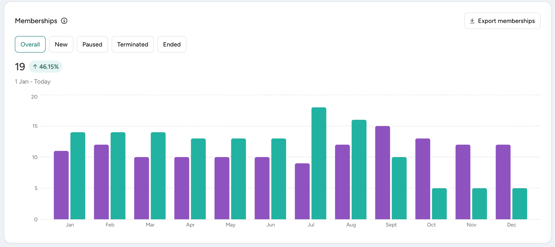
4. Memberships
Shows overall membership development, broken down into:
- New , memberships that started that month
- Paused , memberships that have been paused
- Terminated , memberships cancelled that month (may still be valid until their term ends)
- Ended , memberships whose validity ended that month
2. 📁 Reports: all your exports in one place
The Reports tab gives you an overview of every file you can download and process further , customers, marketing, videos, products, financials, and activities. Click any report to jump straight to the relevant area of the Manager where you can download it.
Below is a guide to what's in each category, and links to the full how-to article for each.
📅 Activities
Export bookings, appointments, and occupancy data. Useful for utilization, attendance, and scheduling analysis.
→ How to export your activity data
👥 Customers
Export your customer list and their booking/product history as a CSV.
→ Working with customer CSV exports
💶 Financials
Export invoices, payments, and financial summaries for accounting or deeper analysis.
→ Which reports can I export, and for what purpose
📦 Products
Export your memberships, services, and products, including status and validity filters (active, inactive, expiring soon, etc.).
→ Exporting the products overview
3. 💡 Getting the most out of Analytics & Reports
Numbers are only useful if you know what to do with them. Here are common business questions studio owners ask, and where to find the answer in your Manager.
1. Which customers booked the most?
2. Which customers bought a trial product but nothing else since?
3. Which bookings were cancelled, and which customers didn't show up?
4. Which customers bought product A but not product B
5. What's the average occupancy of my activities?
6. Which products generate the most revenue?
7. Which promotion codes actually brought in revenue?
8. Which customers' products are expiring soon?
9. Which customers paid the most?
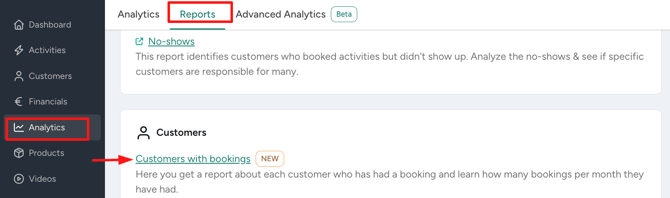
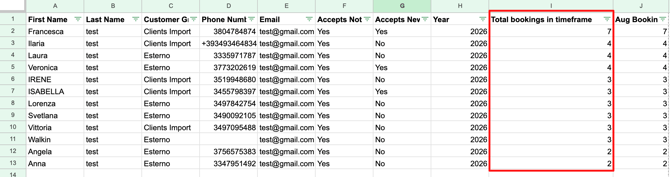
1. Which customers booked the most? |
| 📍 Where to look: |
Analytics > Reports > Customers with bookings
|
| 💡 What to do about it: | Reward loyal customers, for example, offer a perk once they reach a certain number of bookings. You can create an automatic email through the automations to reach out to clients after a certain number of visits: a simple way to thank them for their loyalty, send a discount code, or let them know which rewards they'll get 👉 more details here |
2. Which customers bought a trial product but nothing else since? |
| 📍 Where to look: | Products > Analysis export > Filter by product name. 👉 More details here.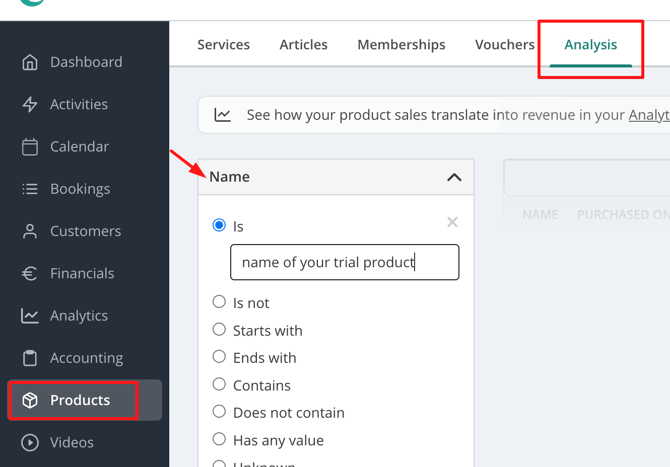  |
| 💡 What to do about it: | Nurture the relationship with these clients to convert them into paying customers. |
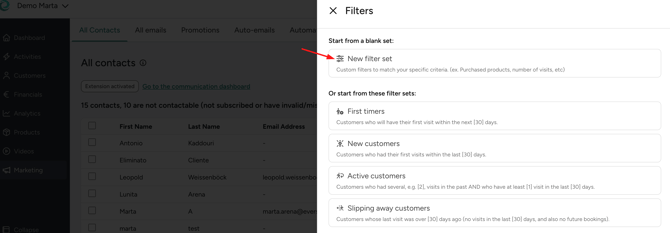
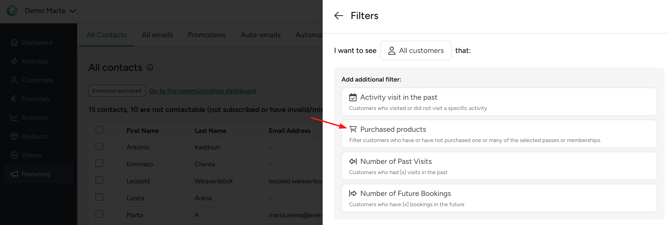
| 📍 Where to look: | To see the contacts list easily in your Manager Marketing > All contacts > Filter  |
| 💡 Tip to filter: |
New filter set: Product purchased: |
| 💡 What to do about it: |
After filtering, reach out to them directly, ask for feedback on their trial class and include your pricing widget link in the email to convert them into paying customers. 👉 Find an example here. |
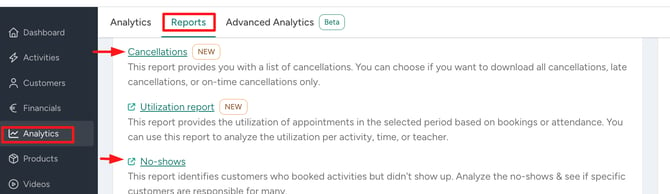
| 📍 Where to look: |
Analytics > Reports > Cancellations & No-shows export.
|
| 💡 What to do about it: |
Adjust your cancellation policy, spot classes with high no-show rates, and identify customers who repeatedly miss bookings. Want to penalise customers who don't cancel and/or don't show up? 👉 Learn more about No-show & Late cancellation Penalty feature! |
4. Which customers bought product A but not product B |
| 📍 Where to look: | Products > Analysis Two Products exports + a lookup formula. 👉 See the full walkthrough here. 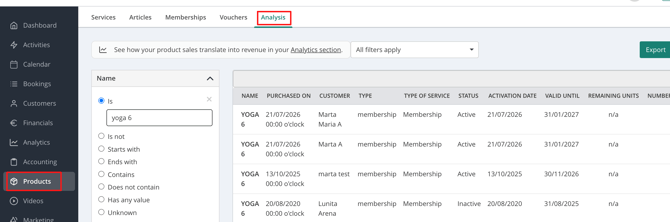
|
| 💡 What to do about it: | Use this to understand for example customers with an active membership who did not purchase insurance. |
| 📍 Where to look: | Marketing > All contacts > Filter 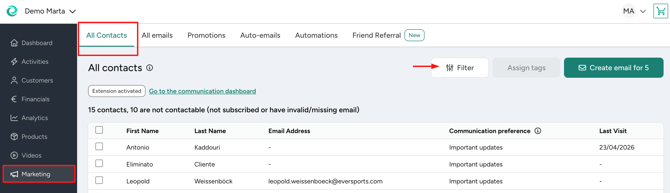 |
| 💡 Tip to filter: |
New filter set: Product purchased: |
| 💡 What to do about it: | After filtering, you can reach out to them directly via the our newsletter tool, or activate automatizations campaign. |
5. What's the average occupancy of my activities? |
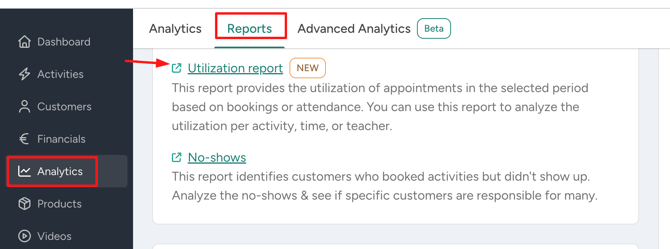
| 📍 Where to look: | Analytics > Reports > “Utilization report ”
|
| 💡 What to do about it: | Use this to decide whether to add, remove, or resize classes based on what's working. |

| 📍 Where to look: | Analytics > Reports > Product Sales and Discounts Overview
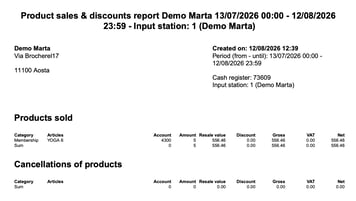 |
| 💡 What to do about it: | Identify your best-selling products, review the discounts applied to each product and track product revenue for a selected time period. |
7. Which promotion codes actually brought in revenue? |
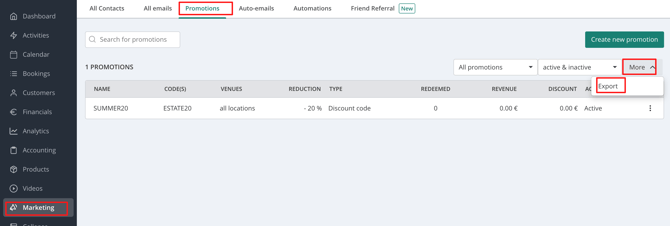
| 📍 Where to look: |
Marketing > Promotions > More > Export |
| 💡 What to do about it: | Keep your best-performing campaigns and stop using ineffective discount codes. |

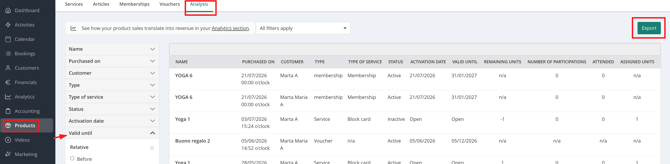
8. Which customers' products are expiring soon? |
| 📍 Where to look: |
Products > Analysis > Filter > Valid until. 👉 See how here.
|
| 💡 What to do about it: |
Example 1 - Block card validity Example 2 - Studio closure |
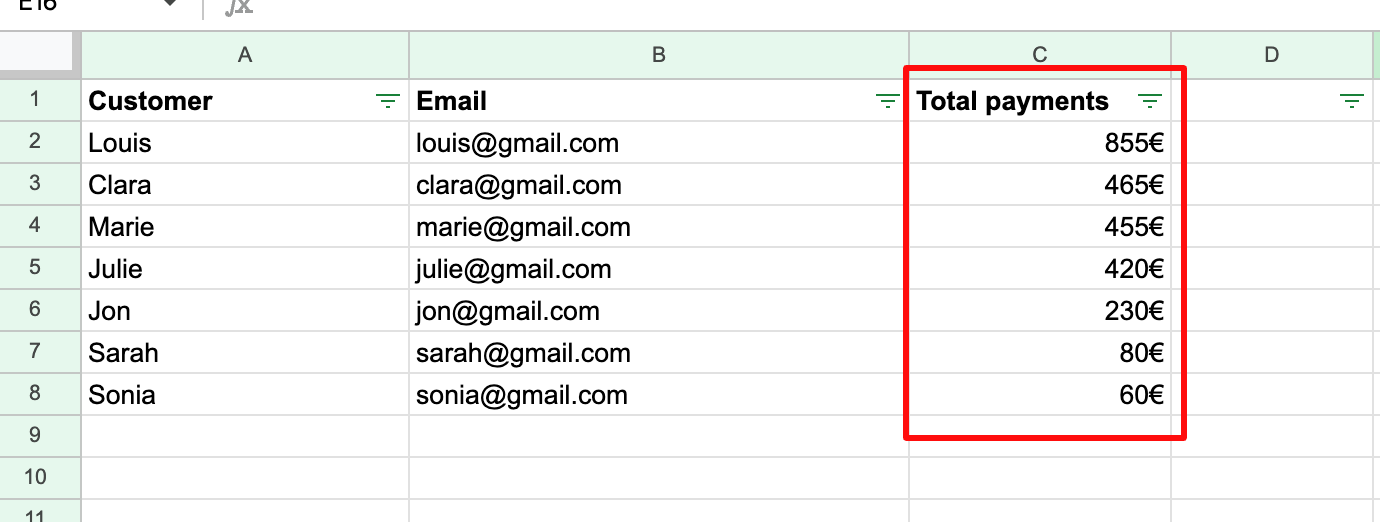
9. Which customers paid the most? |
| 📍 Where to look: |
Analytics > Reports > All invoices with payments. 👉 See the full manual export walkthrough here payments. |
| 💡 What to do about it: | These clients already trust the studio with their money, they're the best candidates to ask for referrals, testimonials/reviews, or to introduce to premium packages, private sessions, or products they haven't tried yet. |

💡 Tips for getting more out of Analytics & Reports:
Before you export:
- Set the correct date range. Most discrepancies people report come from mismatched periods.
- Re-run exports regularly , monthly or quarterly, not just once. Trends matter more than single snapshots.
After you export:
- Remove duplicates before totaling in Excel or Google Sheets. This keeps COUNTIF/SUMIF-style totals accurate.
- Spot-check 1–2 customers. Compare the export total against their profile in the Manager (e.g. "Past visits" or "See all invoices").
- Automate your outreach. Once you know your customers’ booking and purchase habits, set up automations to engage the right audience.
4. 🔍 Advanced Analytics: go further
Need more than the built-in KPIs and charts? The Advanced Analytics extension gives you deeper, customizable reporting for larger or multi-location businesses.
👉 Everything you need to know about the Advanced Analytics extension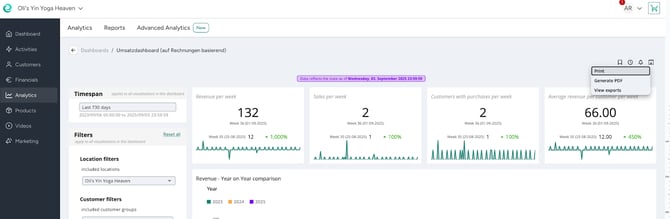
❓Still have questions?
We're here to help! If you're unsure whether a feature is right for your business or need help setting it up, don't hesitate to reach out.
💬 Contact our Support Team if you need personalized assistance, we'll be happy to help you get the most out of Eversports → support@eversports.com
📚 Explore our Help Center for detailed guides and tutorials.